Using the studio
Everything the studio does, in the order you meet it. The studio says what it is and why; this says how to work it.
The studio has one interface, the console: an icon rail down the left (a bar along the bottom on a phone), a ⌘K / Ctrl+K palette that jumps to any view or runs any command, and six themes in light and dark under the gear. Four views are about scenarios and are what this page walks through — Broker, Scenarios, Scenario run and Reports. The other four — Standing loads, Endurance, Delivery evidence and Load designer — are described in the studio's README.
The pictures are captures of the running application, taken by scripts/screenshots.sh,
which drives the studio through this walkthrough against a real broker.
If a screen here looks different from the one in front of you, the one
in front of you is right and this page is behind.
- Starting it
- 1. Connect to a broker
- 2. Design a scenario
- 3. Say what it must prove
- 4. Run it
- 5. Keep the result
- 6. Compare two runs
- Presets
- Files, in and out
- Settings
- When something goes wrong
Starting it
java -jar acemq-workloads-studio.jarThen open http://localhost:8480
(/console is the same page). Java 17 or newer; no
installation, no database to set up, no configuration file.
In a container:
docker run --rm -p 8480:8480 -v acemq-studio:/data \
  ghcr.io/acemq-company/acemq-workloads-studio:latest
The volume is worth it: without it the run history lives in the container's writable layer and disappears with it.
A different port, or somewhere else to keep the database:
java -jar acemq-workloads-studio.jar --server.port=9000 \
  --acemq.studio.database=/tmp/scratch.db
1. Connect to a broker
The Broker view. A scenario needs a broker — the designer asks it which queue types it honours, and a scenario is only worth drawing if it can be run — so Run will not start one without a broker that answered: it brings you here instead.
| Field | |
|---|---|
| Broker (AMQP) | amqp://guest:guest@localhost:5672, or
amqps://… for TLS |
| Management API | http://localhost:15672. Optional, and worth having |

It checks the first time a scenario view opens, and again whenever you press Enter in either box, leave a box you changed, or press Check again or Try again. What answered is what a run uses: when the URL had to be changed to reach the broker, the box is updated to the one that worked. The broker chip beside Run in the Scenarios view always says which broker that is, and pressing it brings you back here. Three things can come back:
- Found a broker. Design a scenario takes you to the designer. The line under it is the broker's own version and the queue types it honours, which is what the management API was asked for.
- Found it, but the management API did not answer. You can continue. Without it the studio cannot tell which queue types this broker honours, so it offers only classic and quorum, and Import from broker is unavailable.
- Nothing answered. It shows every URL it tried and what each said, which is usually enough: a refused connection, a wrong password and a closed port read differently.
The management API is HTTP and wants a user of its own. The studio sends the one written into the AMQP URL, which on every broker anybody points this at is the same user — so filling in the management box is usually all there is to it.
Inside a container, localhost means the
container. The studio knows, and tries
host.docker.internal, host.containers.internal
and the default gateway before giving up — then tells you which one
answered and uses that for the run.
TLS and mutual TLS
An amqps:// URL opens the TLS section. The studio
completes a handshake, not a TCP connect, and reports
the protocol, whether the chain verified, what the broker presented,
when it expires, and whether it asked for a client certificate in
return.
| Certificate authority | The authority that signed the broker's certificate, as a path |
| Client certificate and key | For mutual TLS, when the broker asks who you are. PEM as it comes; the studio builds the keystores itself |
| Accept development certificates | The AceMQ generator stamps its certificates development-only and the library refuses them unless this is on |
| Trust any certificate | Encrypts and proves nothing. For a first run against a broker whose certificate nobody can find |
An encrypted private key is refused, with the openssl
command that decrypts one. Holding your passphrase would make the studio
the thing that leaked it.
2. Design a scenario
The Scenarios view. A Build panel of things to add, open and export; the topology in the middle; the inspector on the right, showing whatever you have selected. Below them, the presets and the scenarios you have saved. On a narrower screen the same panels stack, and on a phone the topology scrolls inside its own box rather than shrinking past legibility.
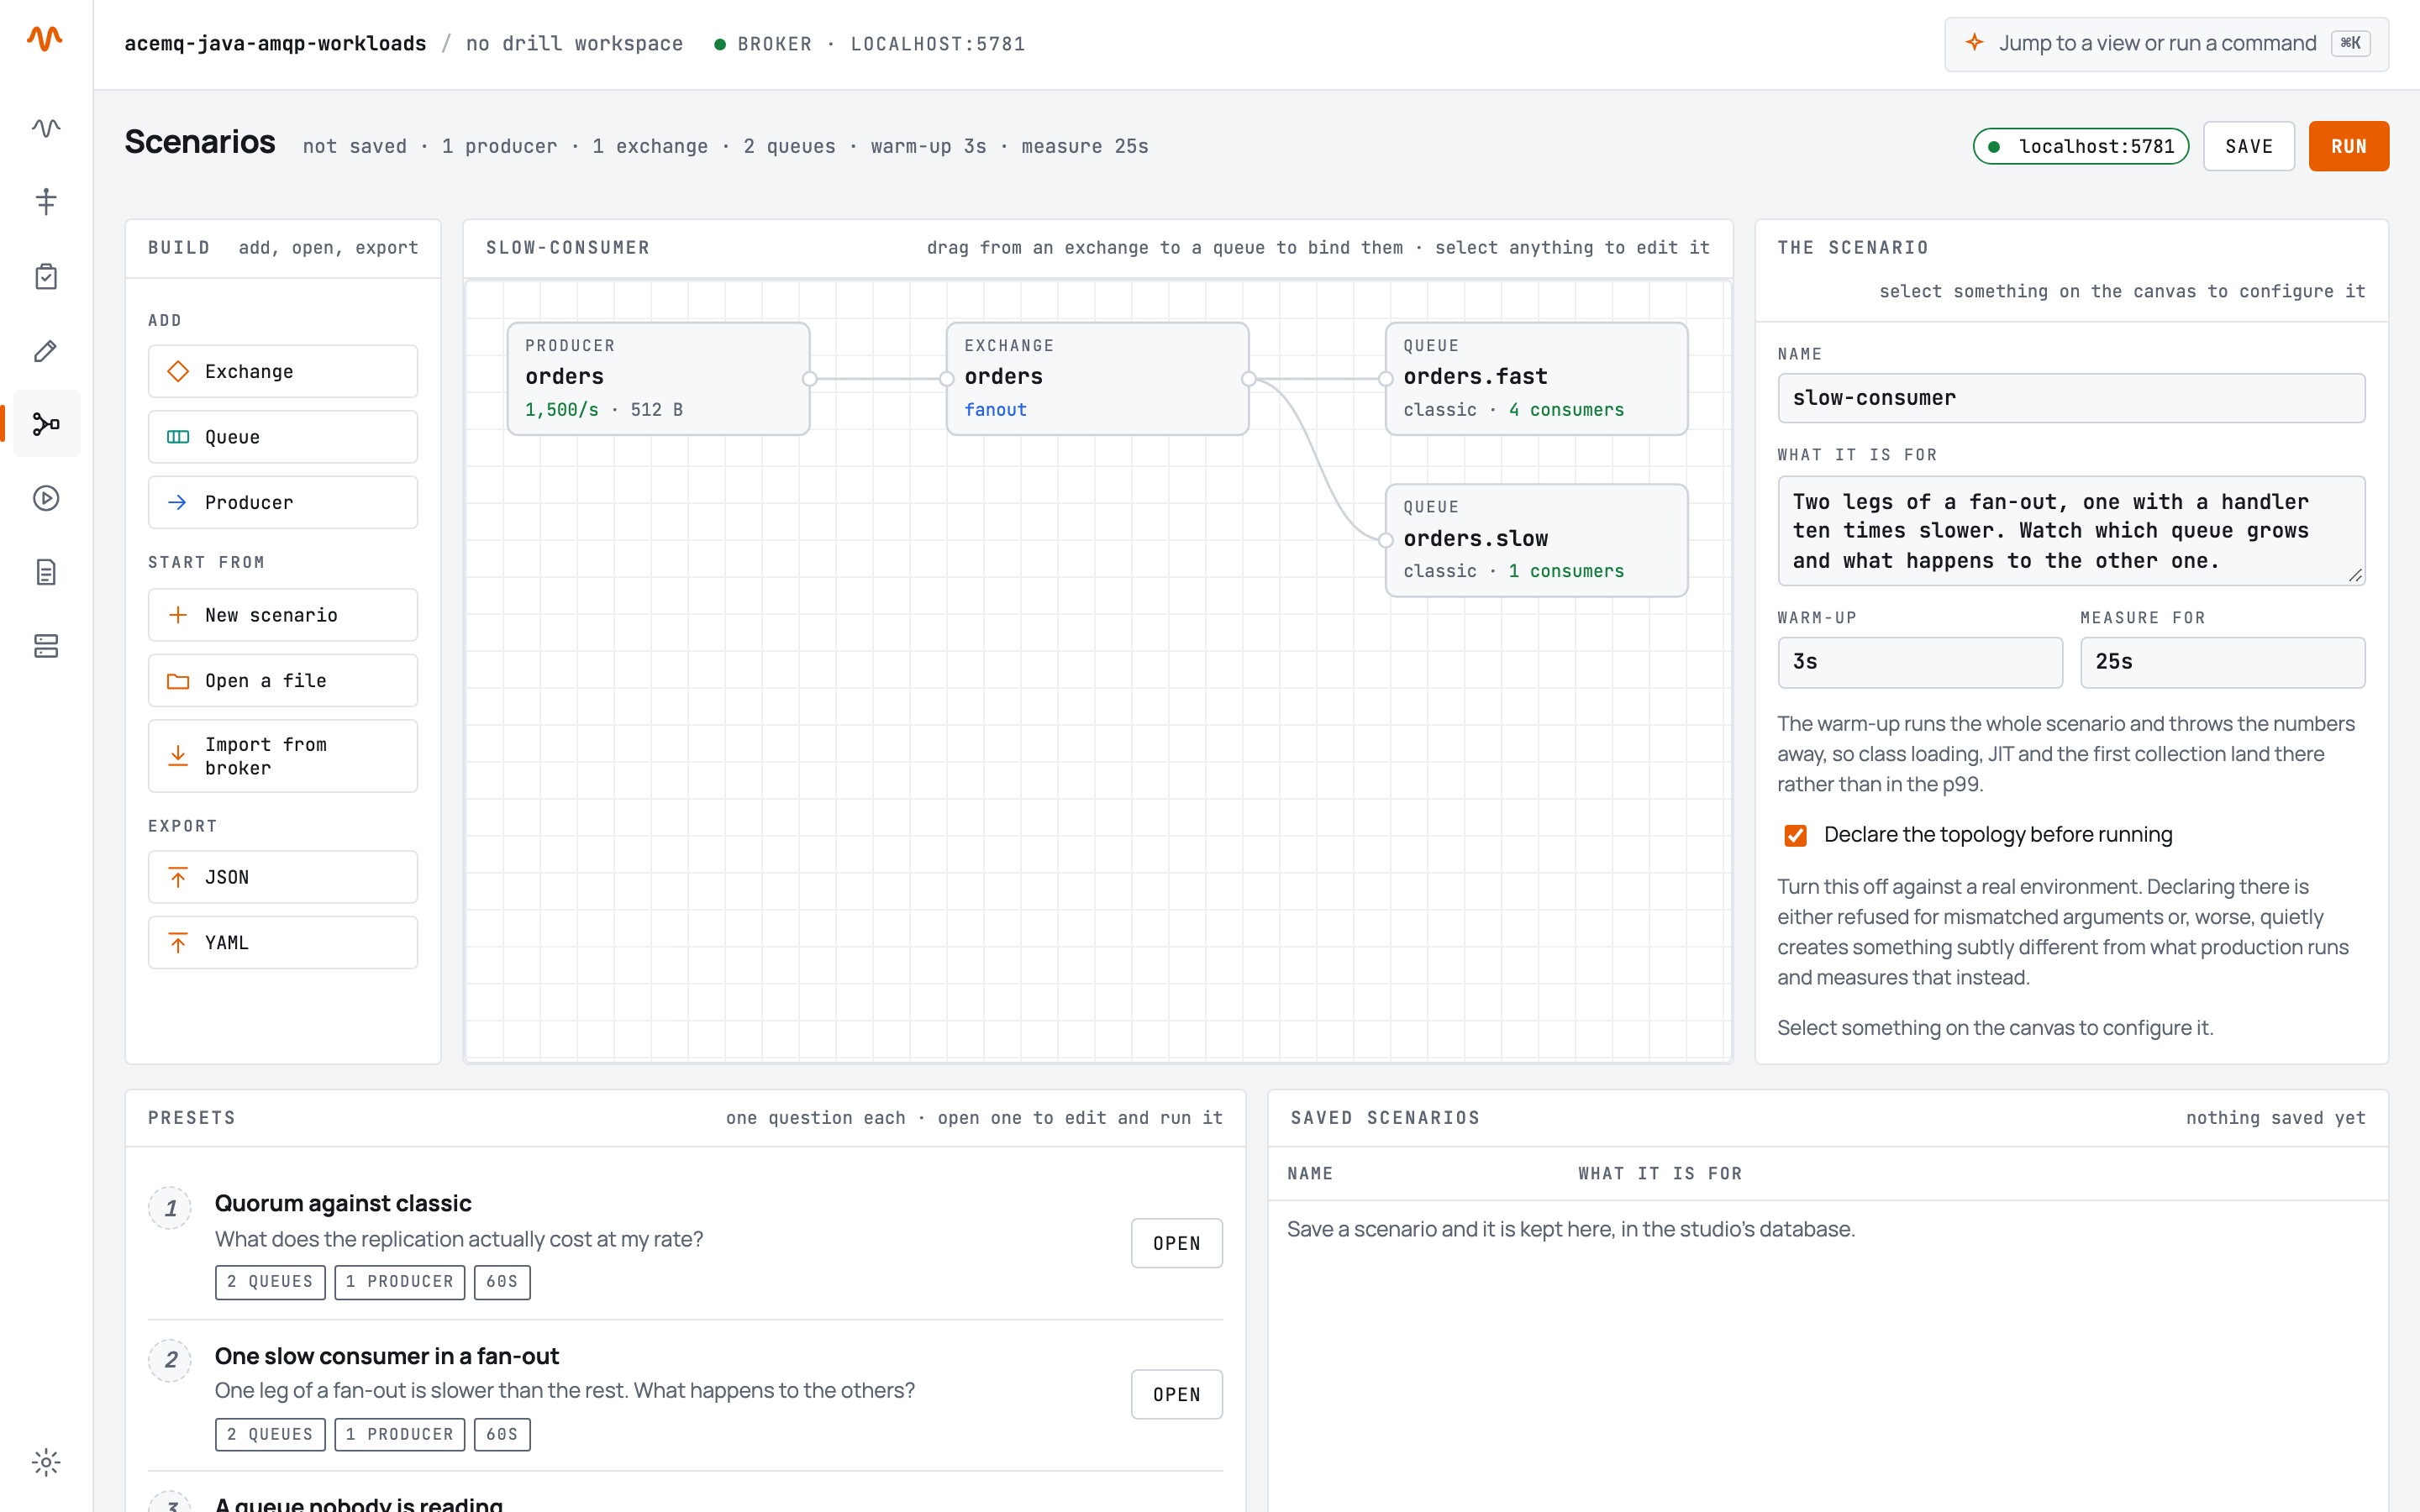
The topology
| To | Do |
|---|---|
| Add a node | Exchange, Queue or Producer under Add, or from ⌘K |
| Bind a queue to an exchange | Drag from the exchange to the queue, or + binding in the queue's inspector |
| Select something | Click it, or tab to it and press Enter |
| Edit the scenario itself | Click the empty space around the nodes |
Producers sit on the left, exchanges in the middle and queues on the right, because that is the direction a message travels. Bindings are the edges, with the routing key on them. The drawing always fits everything in the scenario, however it arrived — a preset, an opened file, an imported topology — so there is nothing to zoom or pan. While a run is going, the edges carrying traffic animate and each node shows its own rate.
The inspector
Nothing selected — the scenario itself: its name, what it is for, the warm-up and the measured window, and whether to declare the topology before running.
Turn declare off against a real environment. Declaring there is either refused for mismatched arguments or, worse, quietly creates something subtly different from what production runs — and then measures that instead.
An exchange — its name and type (topic, fanout, direct, headers), and whether it takes part.
A queue — its name; its type as radio cards, each saying what it costs, with anything this broker will not honour disabled and saying why; a dead-letter exchange; its bindings; its arguments; its consumers.
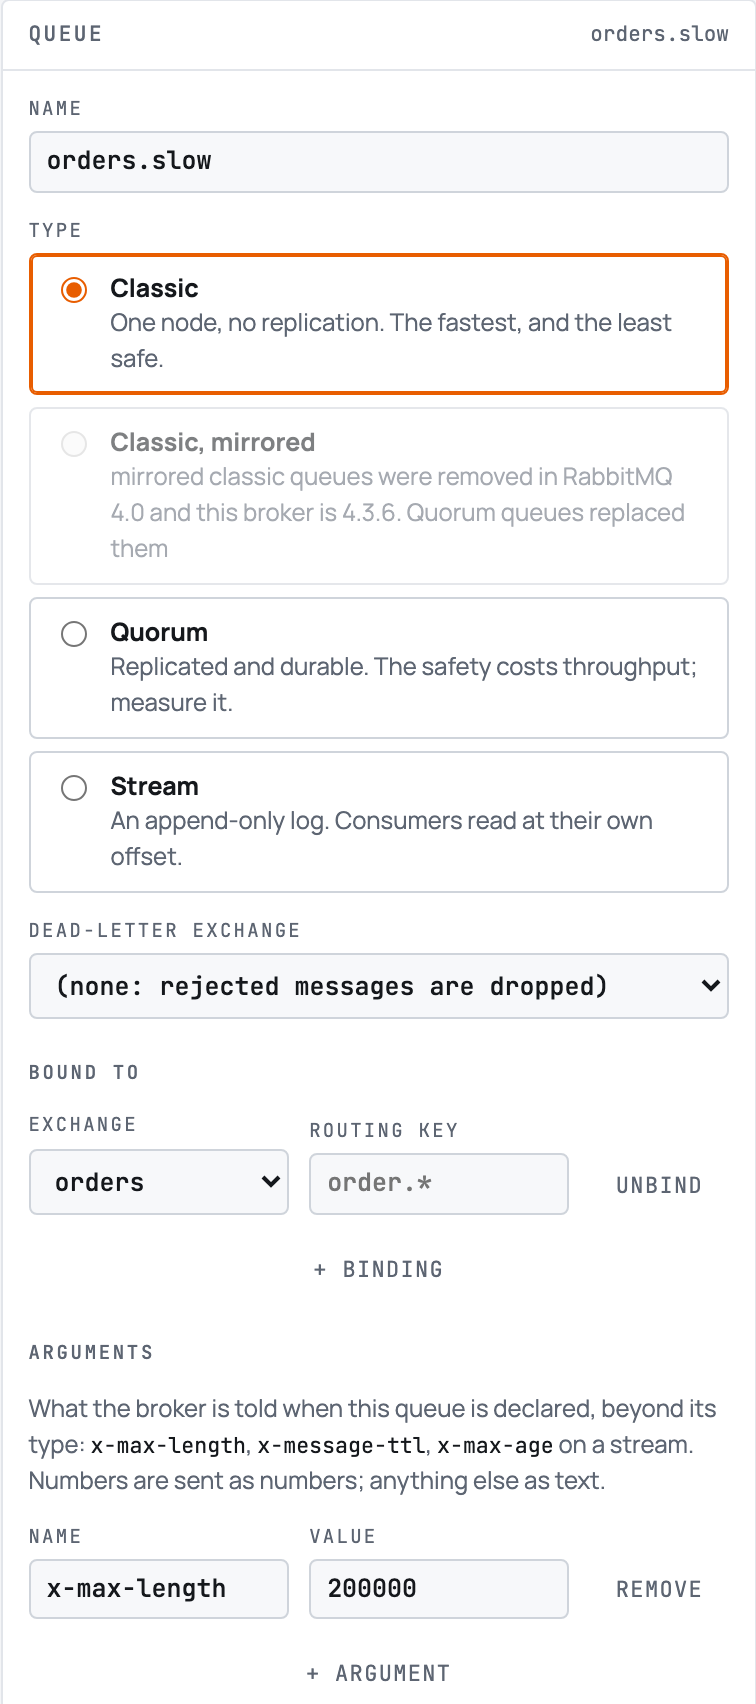
- Bound to — every binding, with the exchange and the routing key both editable, an Unbind button, and + binding. A binding left pointing at an exchange that no longer exists stays visible and says so rather than disappearing.
- Arguments — what the broker is told at declaration
beyond the type:
x-max-length,x-message-ttl,x-max-ageon a stream. Anything that reads as a number is sent as one, becausex-max-length: "1000"is refused where1000is accepted. - Consumers — how many, prefetch, how long the handler takes, and how often it fails. Consumers running switches them off without removing them: the queue keeps filling and the run measures what the backlog costs, which is usually the question.
A producer — where it publishes, its routing keys (comma separated, used in turn), its rate and message size, publisher confirms, and whether it takes part.
Say the rate and let the studio work out the threads. A rate of 0 is unthrottled: it finds the ceiling, and makes the latency meaningless while doing it — the report will say so.
Checking as you go
Every edit is checked against what a broker would accept. Problems appear in red above the panels and disable Run; warnings appear in amber and do not. A binding to an exchange nothing declares is a problem. A queue nobody consumes is a warning, because it is a legitimate thing to measure.
Starting from something that exists
- Import from broker reads the topology off the management API, with consumers switched off. The fastest way to a useful scenario is not drawing one — it is taking the shape that already exists and putting load on the part in question.
- Open a file opens a scenario file, JSON or YAML: the one a pipeline runs, or one exported from here a month ago.
- Presets, under the designer, gives you ten that answer a real question as they stand.
- New scenario starts again from one exchange, one queue and one producer.
3. Say what it must prove
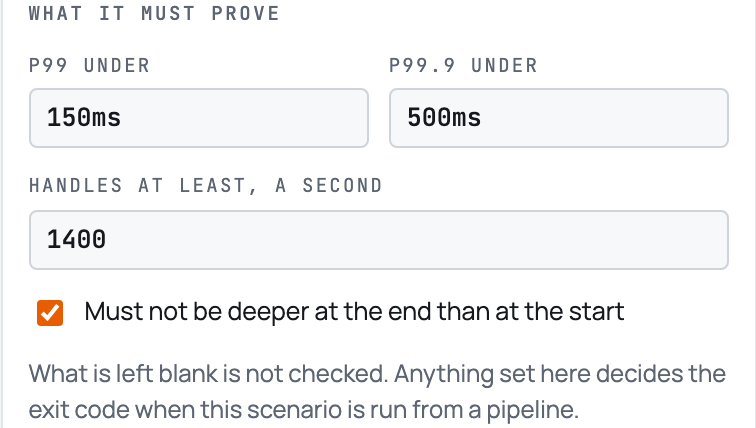
Every queue and every producer has a What it must prove panel. What is left blank is not checked; anything set decides the exit code when the exported file runs from a pipeline.
On a queue:
| p99 under, p99.9 under | End-to-end latency, from when a message was due |
| Handles at least, a second | Messages a second its consumers must manage |
| Must not be deeper at the end than at the start | No growing backlog. Not checked for a stream, which retains what it has served |
On a producer:
| At least, a second | What it must actually offer |
| Within % of the rate | How far the achieved rate may fall short of the configured one |
| Every publish must succeed | No failed publishes |
Set these per node, which is the point: the audit leg may lag as much as it likes while the fulfilment leg must not, and one overall p99 would average away exactly that distinction.
A missed objective is a FAILED finding naming the node
and both numbers, and
java -jar acemq-workload.jar -f scenario.json exits
1.
4. Run it
Press Run. The studio resolves the broker URL first — inside a container the one you typed may name the container rather than your machine — and then starts, and the Scenario run view opens. It follows the run over server-sent events, so a reload, or a second browser, picks it up where it is.
It shows:
- The phases across the top — starting, warm-up, measuring, draining, report — with the one in progress marked, and the elapsed time, the rates and what is waiting in a row of figures underneath.
- Published against consumed, on one chart. While the two lines sit together the system is keeping up; the gap between them is the backlog forming.
- What is waiting, queue by queue, underneath. The same fact as a consequence.
- A card per producer and per queue, with its own rate and totals.
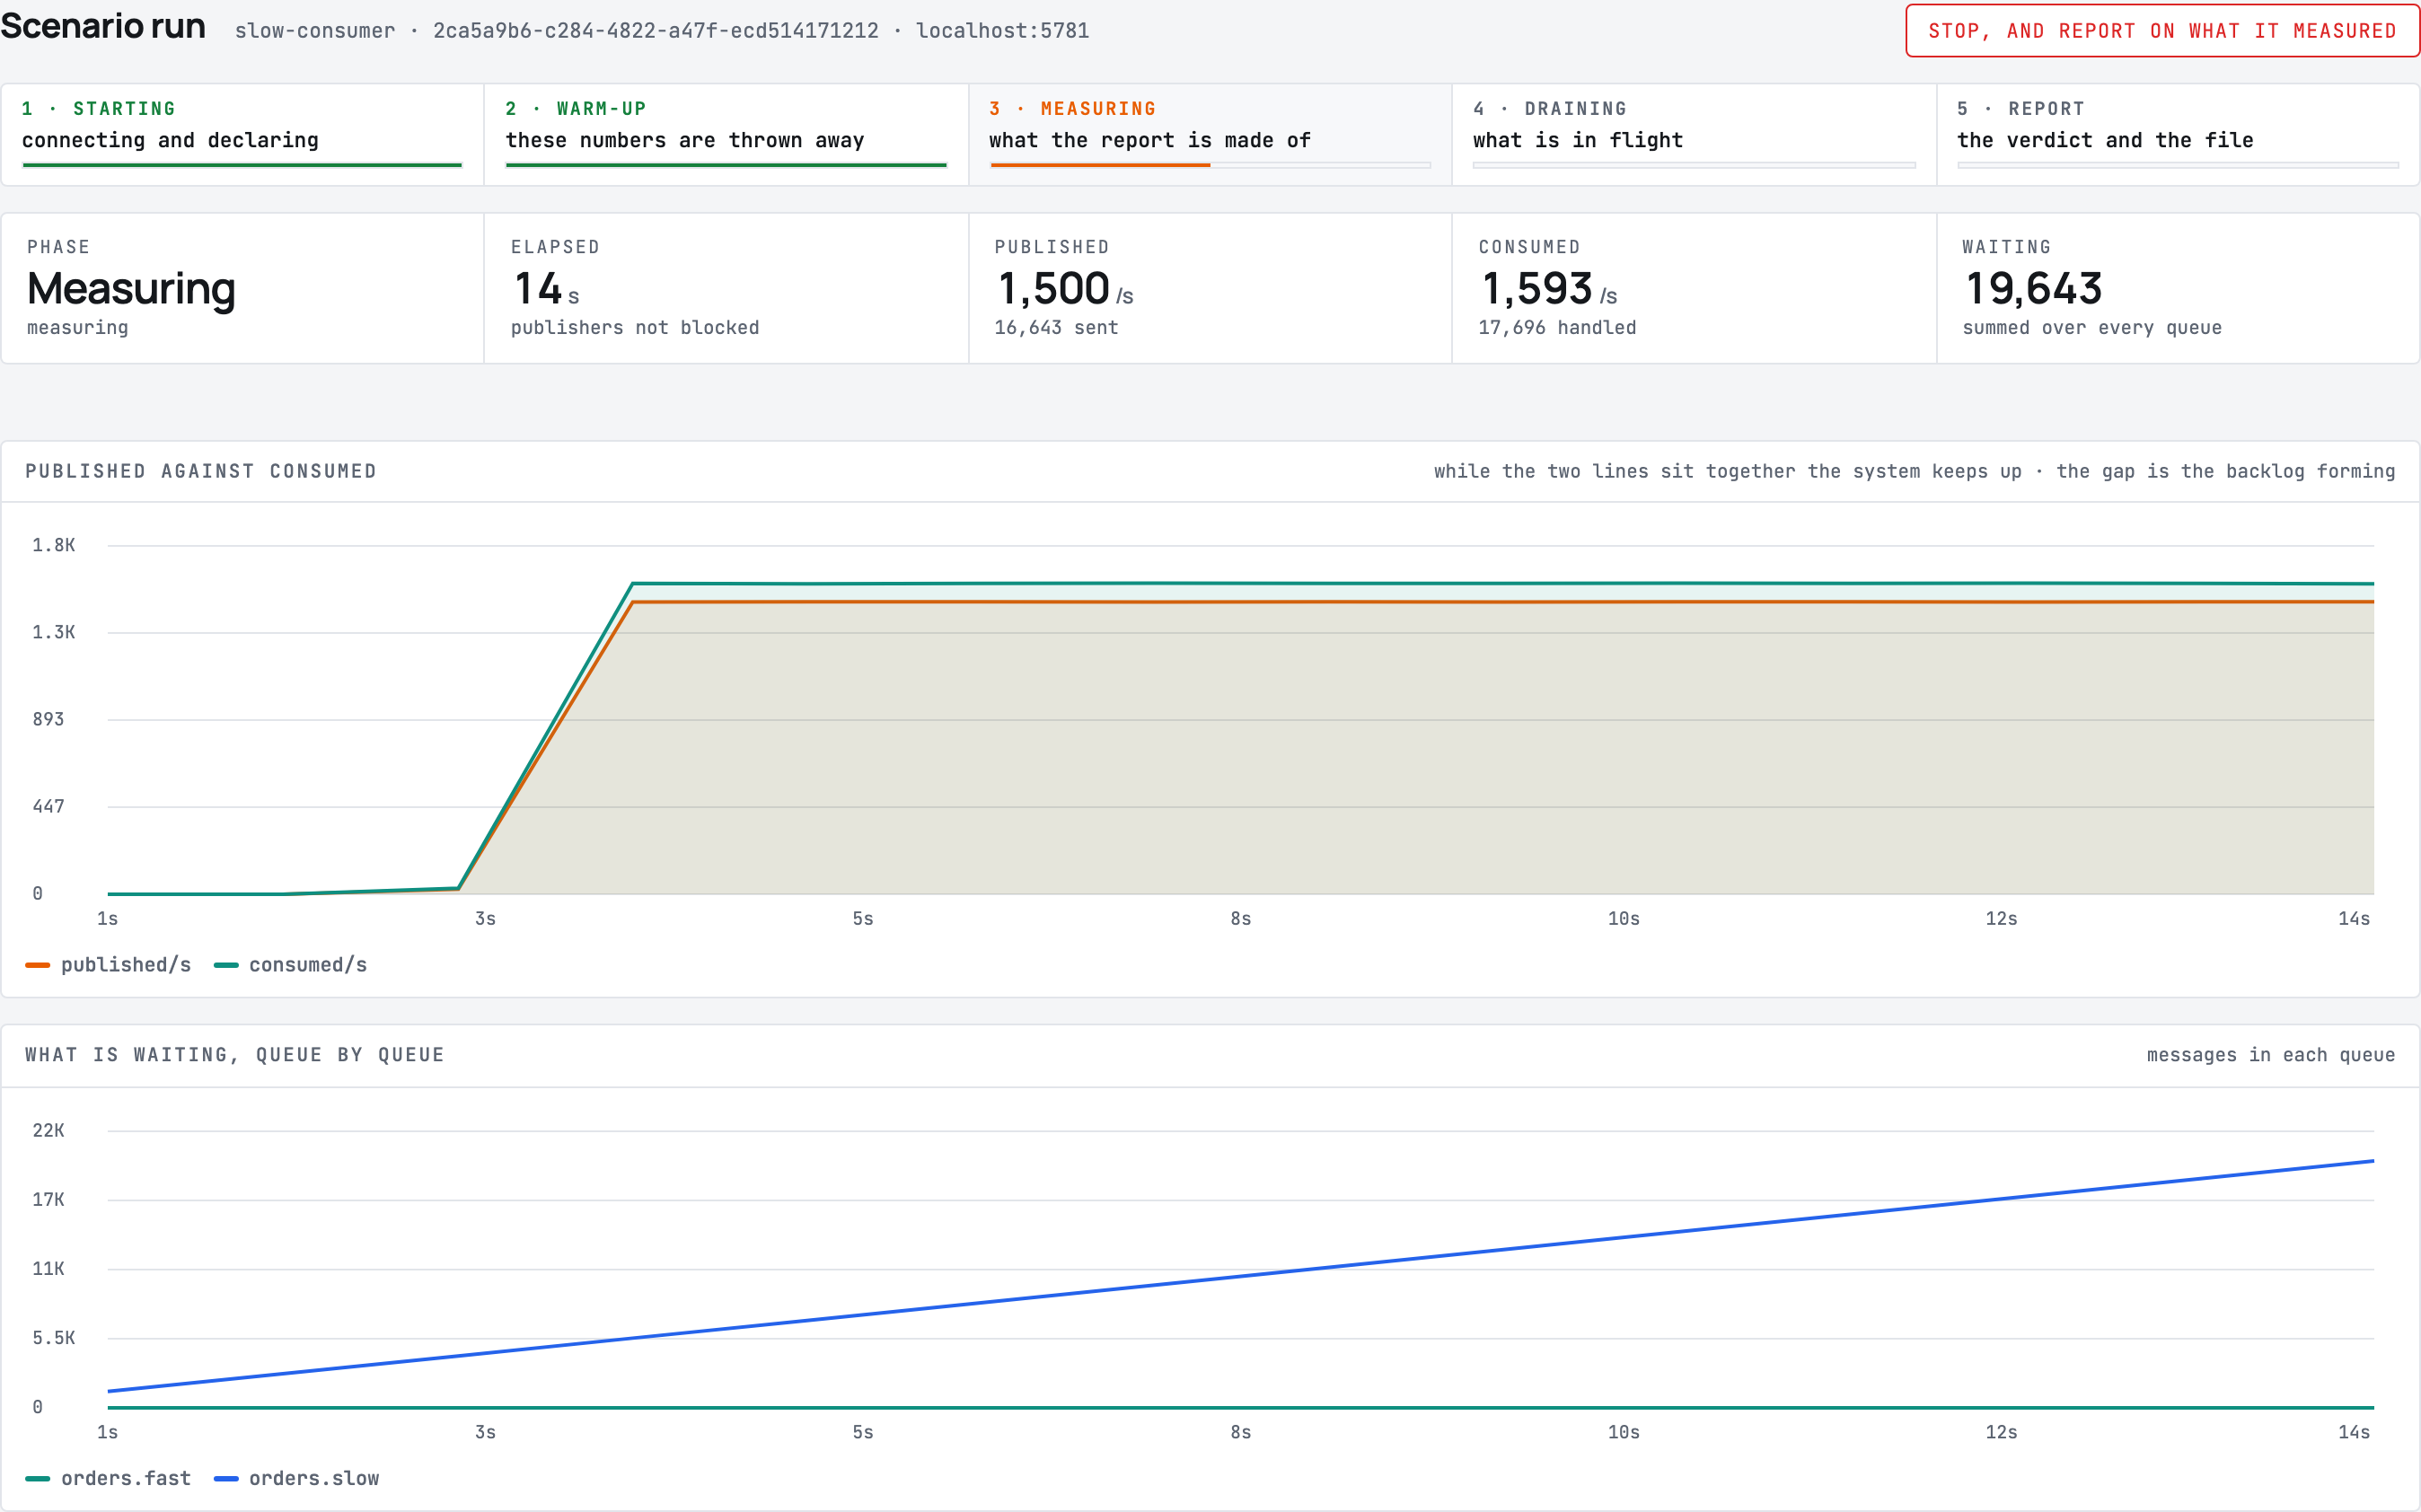
Rates are per interval rather than averages since the start: an average cannot show a stall, it dips a little and recovers.
The phase says what is happening. Warm-up means the numbers are being thrown away — class loading, JIT and the first collection land there rather than in your p99.
Stop, and report on what it measured ends the
measured window early and still produces a report. It is not an abort:
publishers stop, consumers get their usual moment to finish what is in
flight, and the report covers however long the run actually lasted. A
run stopped after twenty seconds trips run-was-long-enough,
which is exactly what should happen.
One run at a time. Two load generators on one machine measure each other.
Reading the verdict
| Passed | Sound run, everything it was asked for held |
| Failed | Sound run, something it was asked for did not hold — the broker's answer is "no" |
| Invalid | The generator never offered the load. This says nothing about the broker; fix the harness |
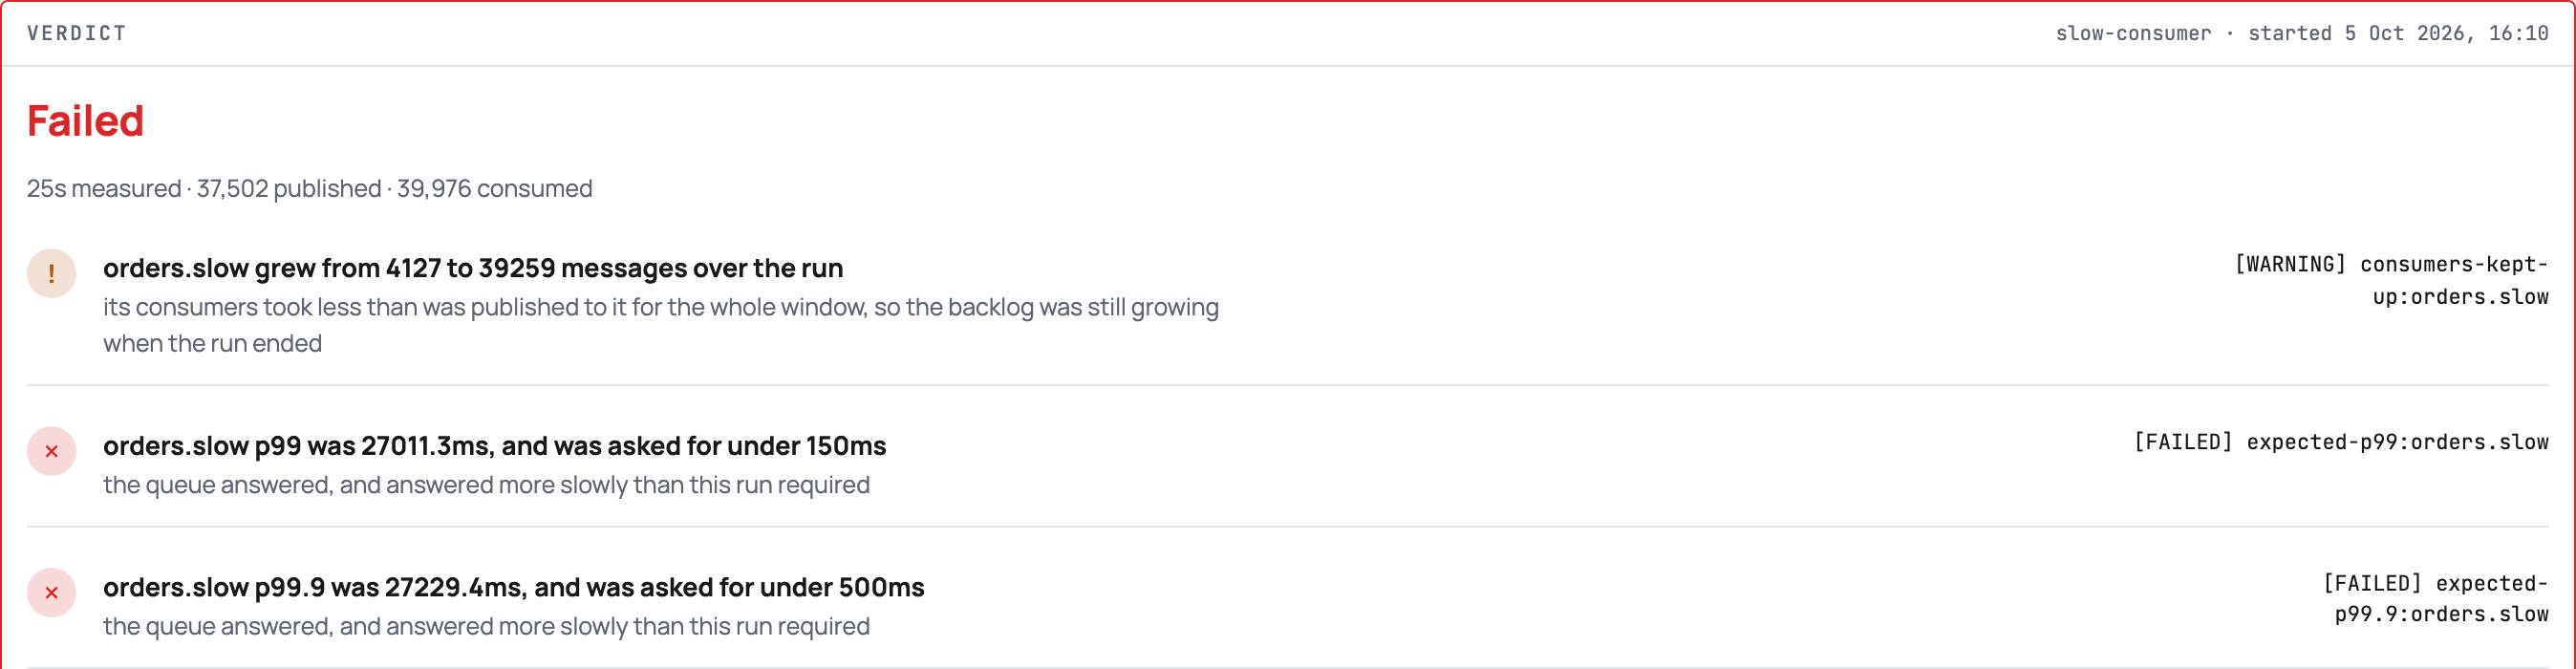
Under the verdict the run view keeps its charts and adds two tables: each queue's type, consumers, rate, p50, p99 and p99.9 and what was left waiting, and each producer's offered and achieved rate, failures, send lag and confirm latency.
Every finding carries the measurement that produced it, and none of them tell you what to change. A tool that prints "increase prefetch to 250" is guessing, and a confident wrong recommendation is worse than silence.
5. Keep the result
Scenarios, runs and every reading go into one SQLite file,
~/.acemq/workloads-studio.db by default.
- Save keeps the scenario. Saved scenarios are listed under the designer, where Open puts one back on the canvas and Delete forgets it.
- Export JSON / YAML downloads
acemq-workload-<name>-<date>.json, the file the command line reads. - On a finished run, HTML, Markdown and JSON at the top of the run view save the report — the same document the command line writes, so what goes into a ticket is the report rather than somebody's memory of it.
- Reports lists every run: the scenario, the broker with its password redacted, when it started, how it ended, and its report as HTML, Markdown and JSON links. Open draws a finished run again exactly as it was watched. Delete forgets it and its readings.

The 200 most recent runs are kept and older ones are dropped as new
ones finish. --acemq.studio.keep-runs=1000 if you want
more.
6. Compare two runs
In Reports, tick two finished runs and press Compare. A third tick drops the oldest of the two rather than refusing.
Tick the older one first. The one ticked first is the before column, and the table lists the newest run at the top — so ticking straight down the list puts the new run in before and reports every improvement as a regression.
Nothing empties a queue between runs. A run that ended with a backlog leaves it there, and the next run against the same broker starts behind by however much — which shows up as a latency ten times anything the first run saw, and is the harness rather than the change being measured. Delete the queues, or use a fresh broker, before comparing two runs that both build a backlog.
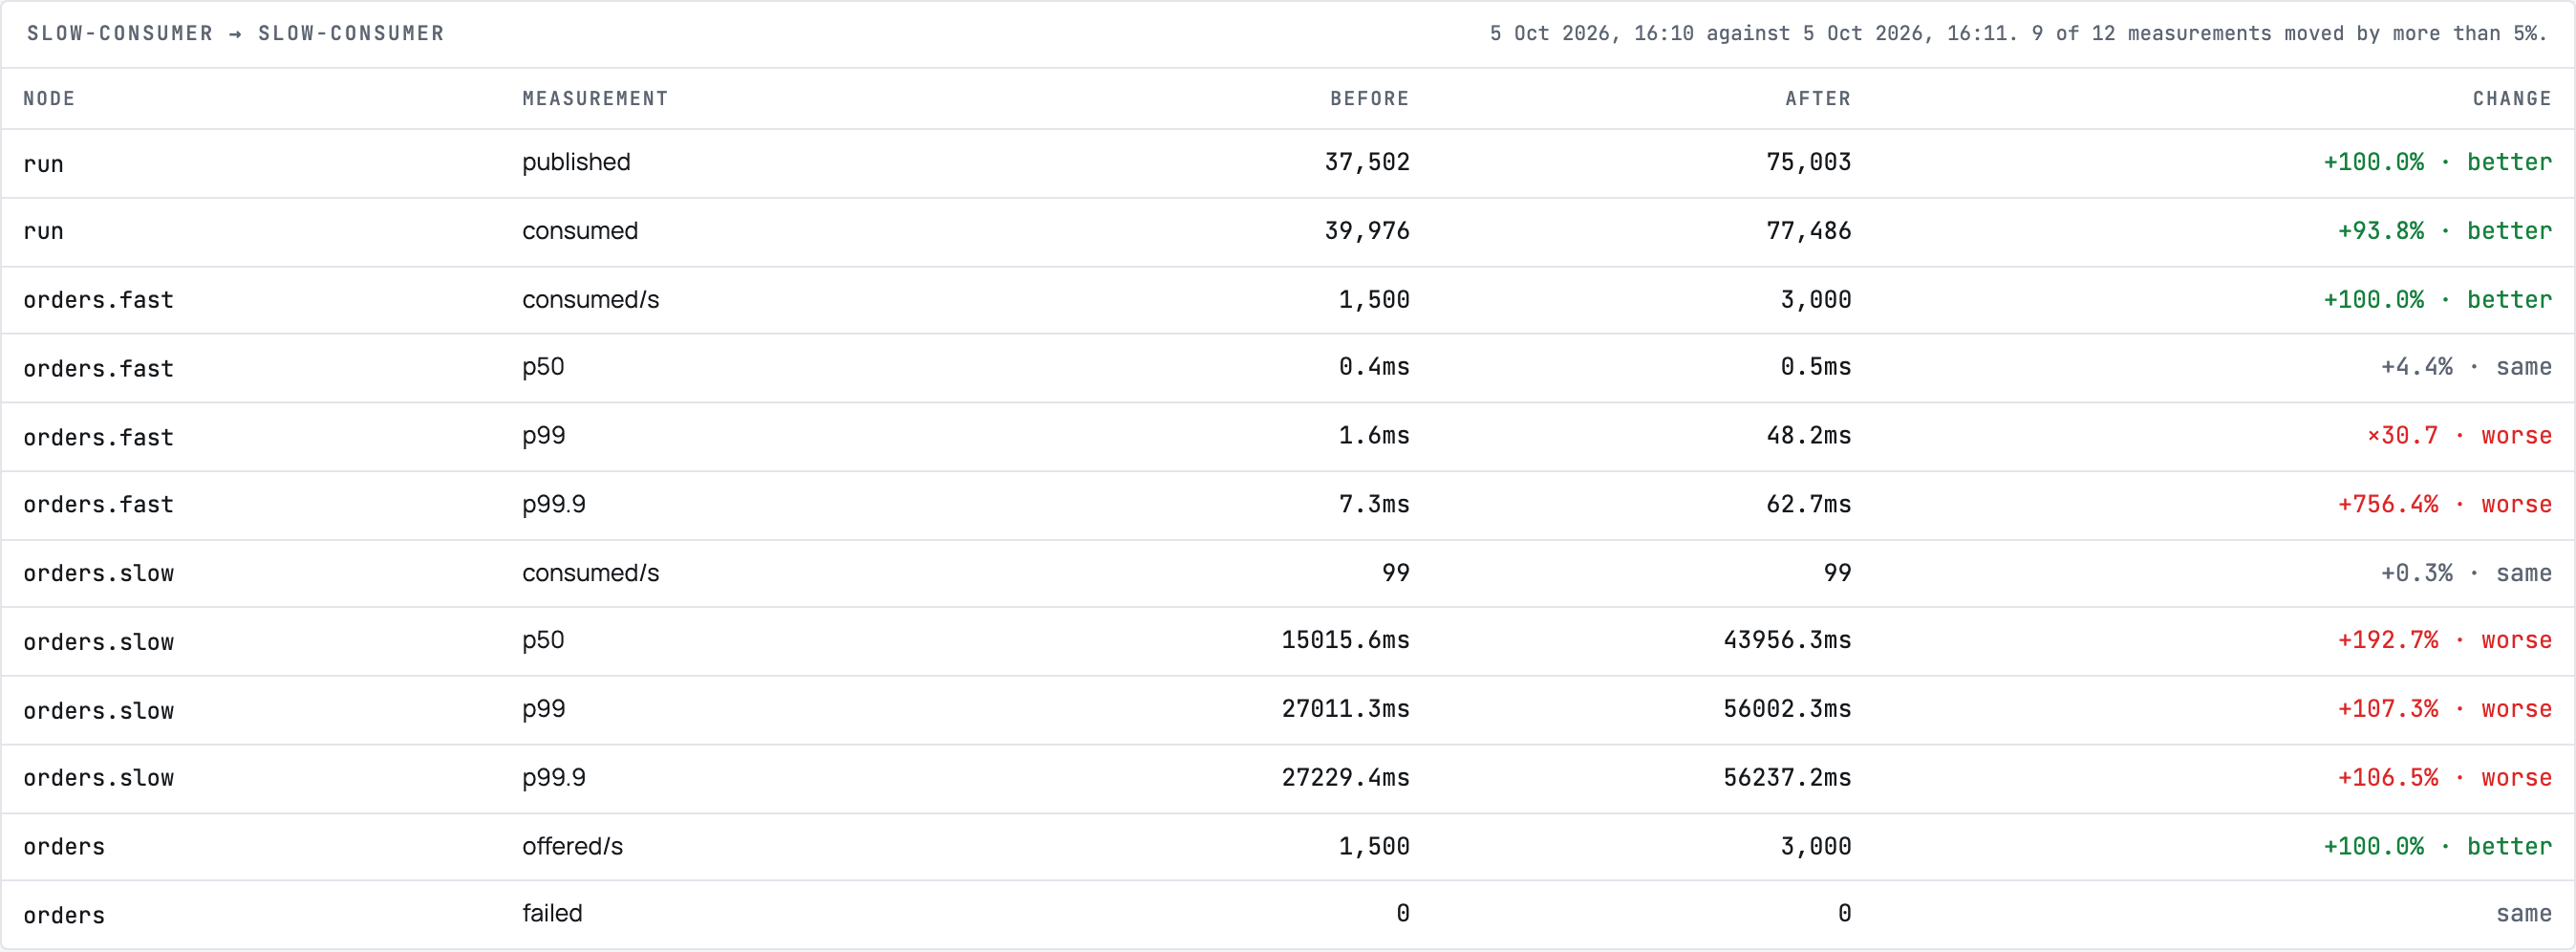
Every measurement the two have in common, with the direction made explicit: a latency that went up is worse, a rate that went up is better, and the table says which rather than leaving you to work it out from the sign.
Anything inside ±5% is reported as same. Two runs of one configuration differ by a few percent on ordinary hardware, and a tool that called that a regression would be switched off within a week. A node only one run had is shown as only before or only after rather than dropped — comparing a scenario with a queue against the same scenario without it is a comparison, and hiding the queue would hide the only thing that changed.
Presets
Under the designer, or Preset: in the ⌘K palette.
Open one and it lands on the canvas, yours to edit.
Measurements isolate one variable:
| Quorum against classic | What does the replication actually cost at my rate? |
| One slow consumer in a fan-out | One leg is slower than the rest. What happens to the others? |
| A queue nobody is reading | How fast does a backlog build, and what does the broker do about it? |
| Prefetch, high and low | Is prefetch the thing limiting this, or is it the handler? |
| A dead-letter path under load | Handlers are rejecting traffic. Where does it go, and how fast? |
| Find the ceiling | How much can this broker take before it stops keeping up? |
Shapes are whole topologies:
| Every routing rule at once | Direct, topic and fanout together: does each deliver what it should? |
| Event-driven commerce | Orders broadcast, payments by exact type, shipping by pattern |
| A trading venue | Market data fanned out to four desks, one of them slow; orders by instrument |
| Many writers, one queue | Eight services into one queue. Where does the contention show up? |
Most carry their objectives already. find-the-ceiling
deliberately carries none: it is unthrottled, and its latency means
nothing.
Files, in and out
The studio and the command line read and write the same file, which is the whole point of the designer:
# designed here, exported, and run in a pipeline
java -jar acemq-workload.jar -f acemq-workload-orders-2026-09-07.json \
  --broker "amqp://guest:$PASSWORD@staging:5672" \
  --report reports/ --format html,json --quiet
${VAR} in a file is resolved from the environment by the
command line, so a password never has to live in a file that gets
committed. The studio does not resolve it when opening
a file — doing so would read the studio's own environment on behalf of
whoever opened the file and hand the value back.
Settings
Command-line flags, or the environment variable beside them.
--server.port / SERVER_PORT |
The port. 8480 |
--acemq.studio.database /
ACEMQ_STUDIO_DATABASE |
Where state lives. ~/.acemq/workloads-studio.db |
--acemq.studio.address /
ACEMQ_STUDIO_ADDRESS |
What to bind to. Loopback on a machine, everything in a container |
--acemq.studio.token /
ACEMQ_STUDIO_TOKEN |
The access token. Generated and printed when the studio is exposed and nobody set one |
--acemq.studio.keep-runs |
How many finished runs to keep. 200 |
ACEMQ_STUDIO_ALLOW_REMOTE_WITHOUT_TOKEN |
Run exposed with no token. There is a legitimate case for it, and it has to be set deliberately |
On a machine the studio binds to loopback and needs no token. Exposed — which is what it does in a container, because loopback there would be unreachable — it requires one: a load generator open on a network is a way to point traffic at somebody else's broker.
When something goes wrong
"Nothing answered." Everything tried is listed with what each said. From a container, check whether the broker is on the host rather than in the network.
The queue type I want is disabled. The broker was not asked. Give the studio a management URL and press Check again. Mirrored classic queues are disabled against RabbitMQ 4.0 and later because they were removed there.
The run says INVALID. The generator did not offer the load, so the run measured the generator. Lower the rate, or give the producer more threads, and run it again. Reporting this as a failure would blame the broker for the client's limit.
The p99 looks impossible on an unthrottled run. It is. An unthrottled producer stalls when the broker stalls, so the latency it records is the broker's service time rather than the wait. Find the ceiling first, then measure latency below it.
A run will not start: "a run is already going". One at a time, deliberately. Stop the other one, or wait for it.
The studio will not start: the port is taken.
--server.port=9000.